


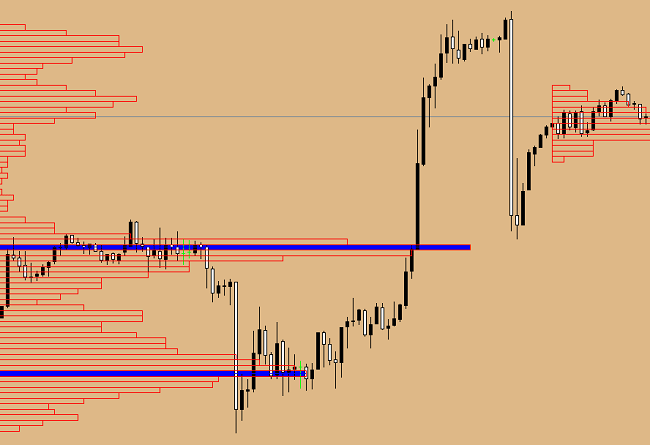
Today I want to tell you about the technical analysis tool, which can be a useful component of a trading strategy. The VPFx indicator draws a histogram on the price chart, the lines of which indicate the number of ticks for each price value. The maximum indicator forms an important level that can be used in the process of making trade decisions. It is highlighted on the chart by a blue line. Indicator installation in the MT4 trading terminal is performed according to the usual scheme. On the VPFx chart, the indicator looks like this:
VPFx indicator parameters
Parameter Range Period can be used to specify to the indicator the period of time in minutes, which should be used in calculations.
Histogram, which displays the tick volumes during the trading day, is called a cluster. The Range Court parameter allows you to choose the number of clusters you want to see on the chart.
The Mode Step parameter is the number of histogram values from which the indicator calculates the mode. Modes are the largest volumes for a certain period of time.
Other parameters in the settings of the indicator are used for visual design of the histogram (color, line width). They do not affect the indicator’s readings in any way.
In addition to the settings of the indicator itself, you should change something in the chart settings. To do this, open the “Charts” tab of the trading terminal and set the maximum possible number of bars in the history and window.
And now let’s move on to the question of practical application of the indicator.
Recommendations for using VPFx in trading
Of course, you can’t trade only on this indicator.
A trading strategy should include other tools to analyze the situation on
market and making decisions on opening transactions.Attention should be paid to the bright blue lines that
are significant and can be considered as
strong support or resistance levels. If the price has reached the fashion, and other indicators give signals
to open trading positions, it means that now is a good time to enter
the market. VPFx indicator can also be used to close trade orders. If the price touched the blue level, and other instruments of techanalysis indicate a change in trend, it is better to close the active order or transfer it to a lossless position.I recommend that you consider this technical analysis tool for possible use in your trading. But you have to estimate its efficiency in demo trading beforehand.Fyodorov’s Inga19.07.2019